Grafana is one of the most popular open-source tools for monitoring and visualisation. By connecting Orca Scan to Grafana, every barcode scan in your workflow can be transformed into live dashboards, KPIs, and alerts - no code or custom plugins required.
Why connect Orca Scan to Grafana?
Barcode scans capture what’s happening in the real world: items moving through warehouses, deliveries arriving on time, equipment being checked in/out. Grafana turns that data into a interactive display that makes it easy to understand your operations at a glance:
- Supply chain visibility - track stock levels, shipments, and handovers in real time
- Operations - watch production lines, field inspections, or asset movements as they happen
- Performance – set live KPIs for teams, sites, or processes and see progress instantly
- Exception - see visual alerts when thresholds are hit (e.g. low inventory, overdue deliveries)
How to connect Orca Scan to Grafana
All data in an Orca Scan sheet can be exposed as a Live Data URL. This URL allows external systems to request Orca Scan sheet data in formats such as CSV, JSON, XML or HTML in real-time.
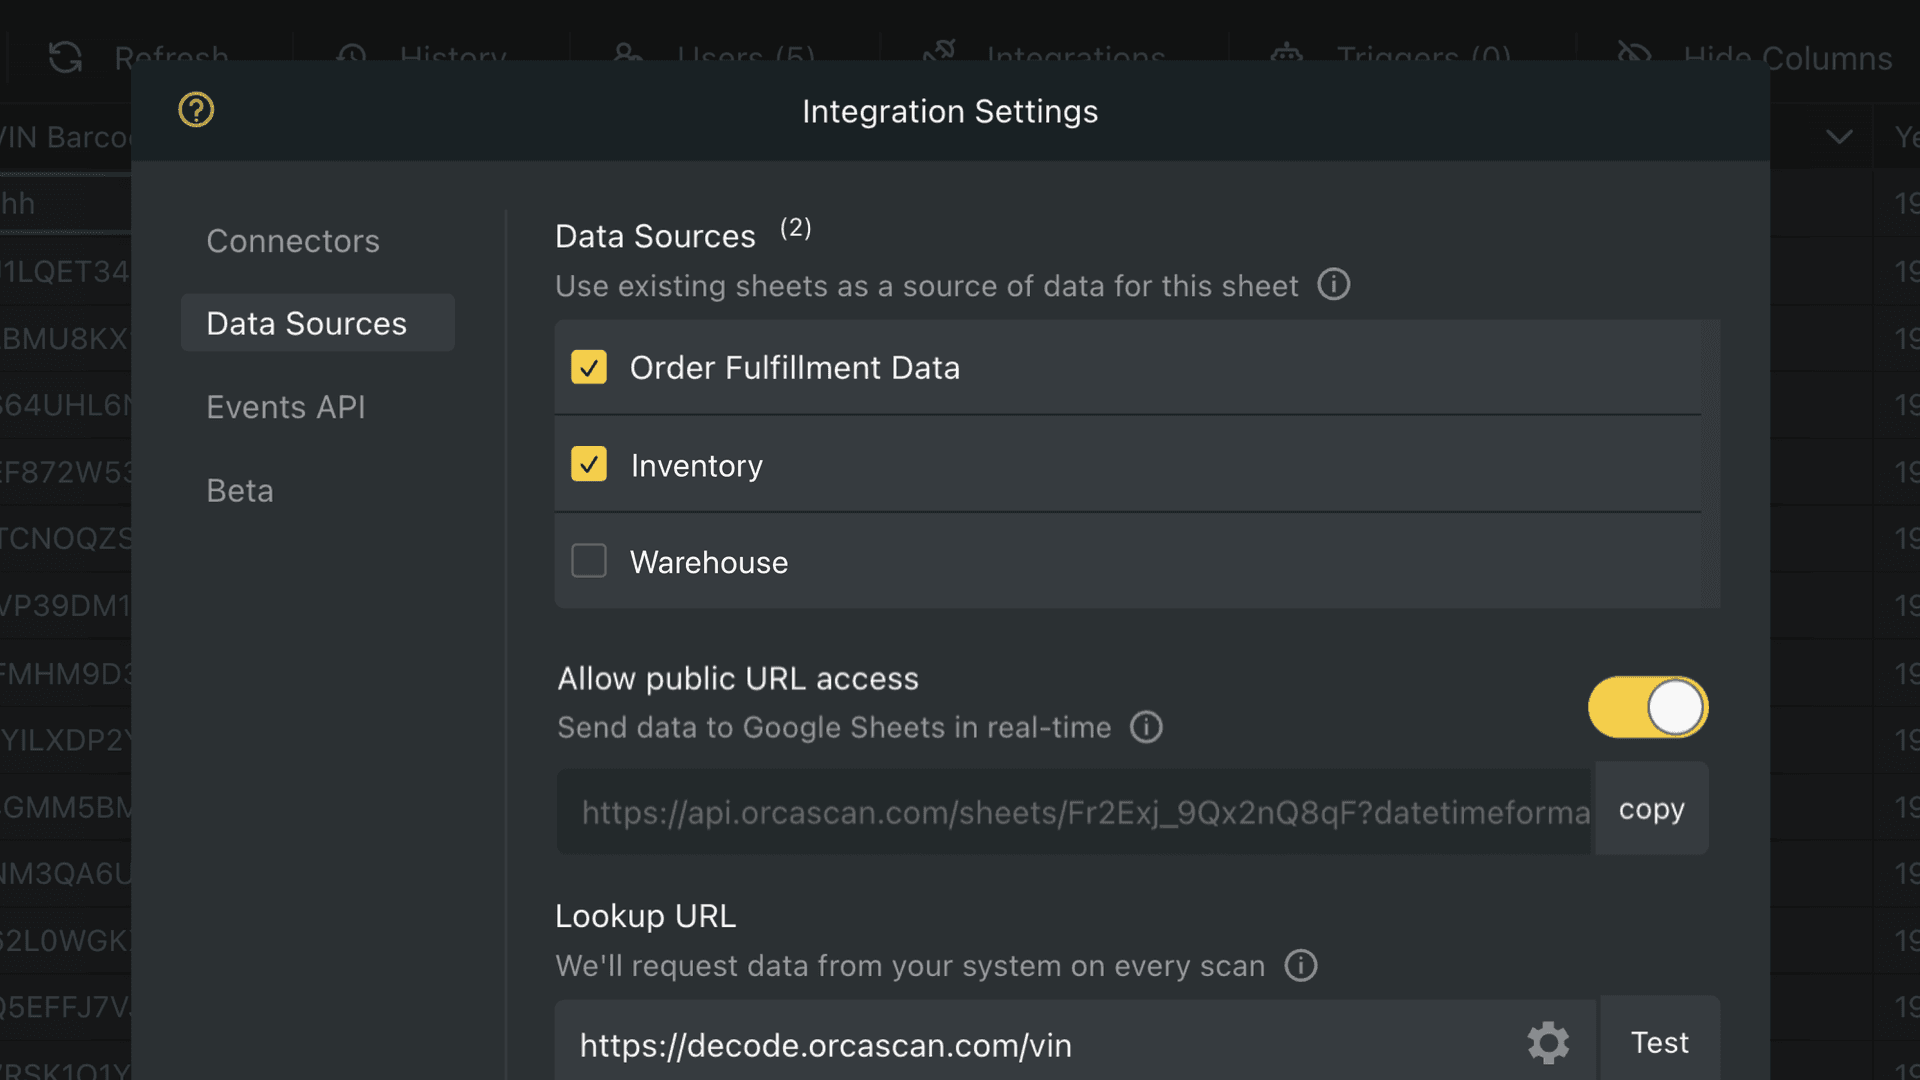
1. Turn on the Live Data URL for your sheet
- Login to your Orca Scan account
- Select the sheet you wish to visualise
- Click Integrations at the top of your Orca sheet
- Turn on and copy your Live Data URL
- Save the changes
Your Live Data URL is now ready. You can use .csv or .json by adding the extension to the end of the link when needed. Now, head over to Grafana.
2. Set up in Grafana
Create a free Grafana Cloud account or sign in to your stack. Grafana Cloud Free lets you install community plugins like Infinity and build dashboards at no cost.
3. Install the Infinity plugin
- Open Connections
- Select Add new connection
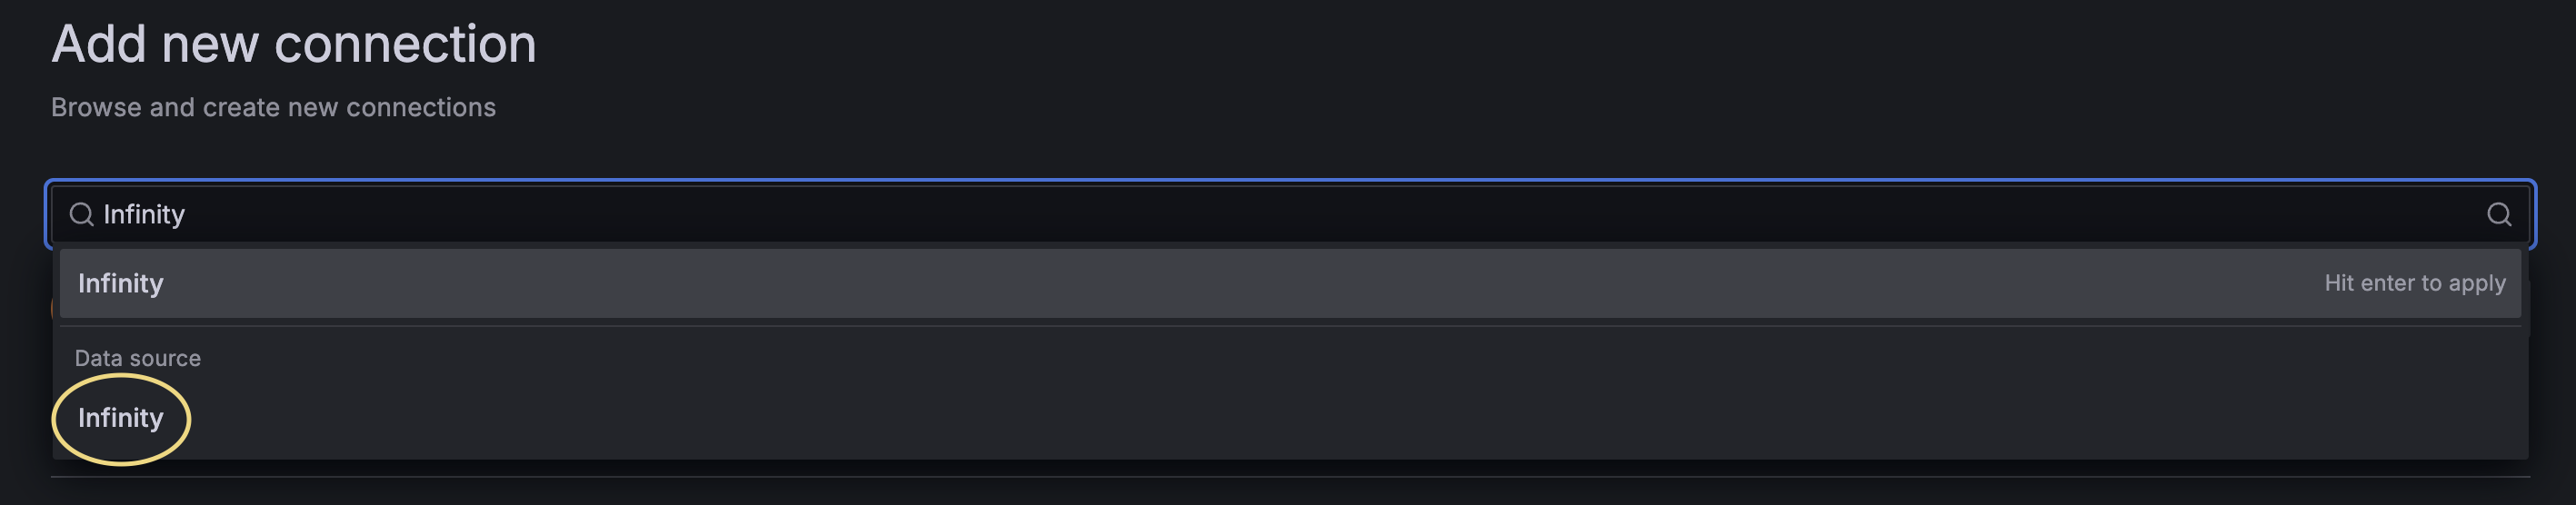
- Search for Infinity
- Click Install in the top right
4. Create a Grafana Data Source
- Find Data sources under the Connections tab
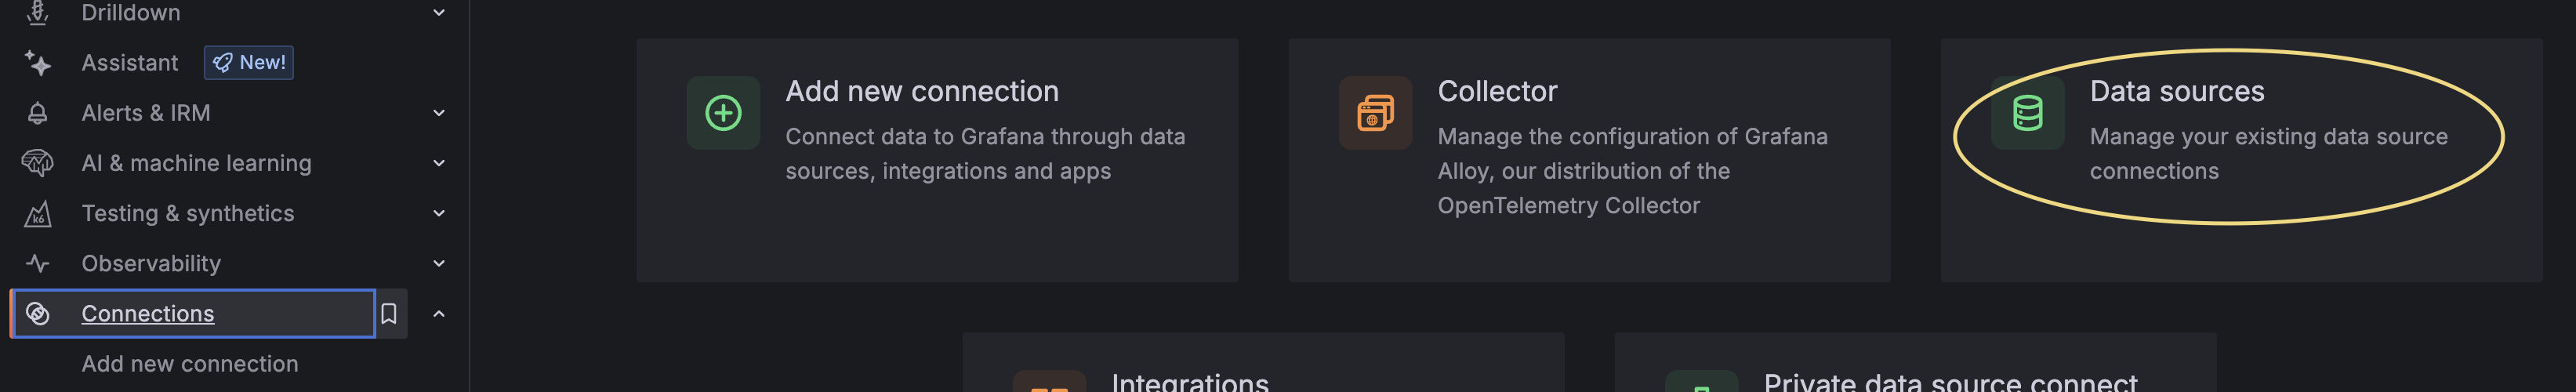
- Click Add new data source
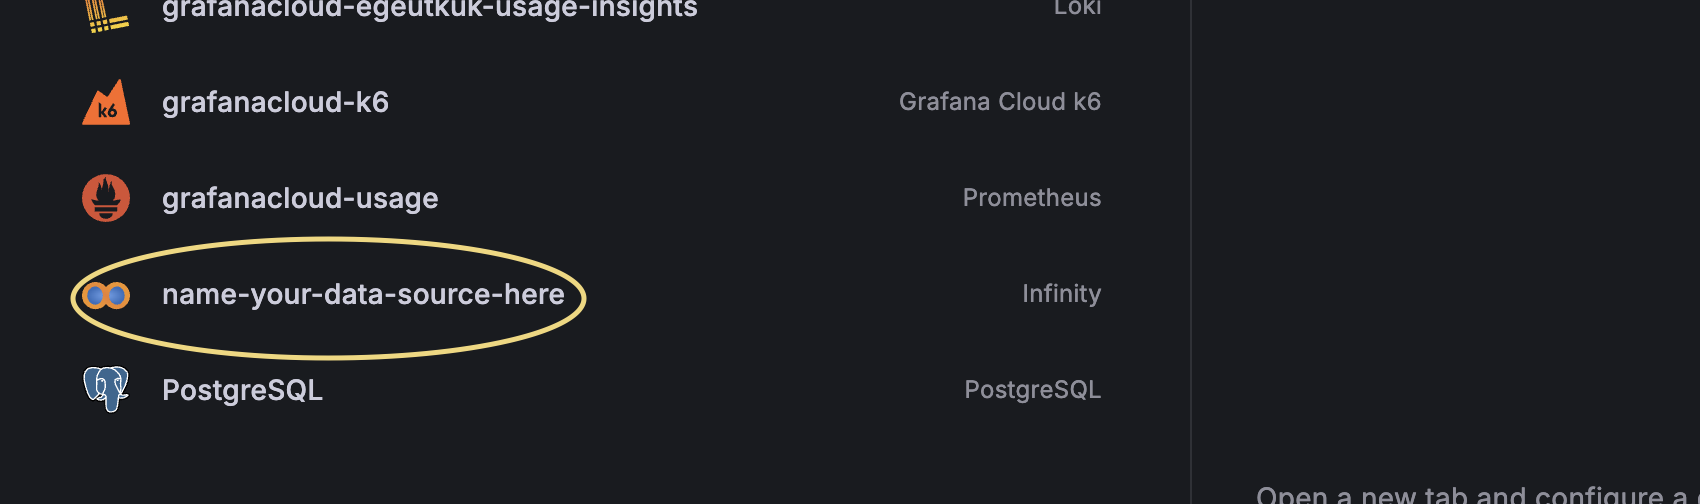
- Search for Infinity and select it
- In Main, give the data source a clear name
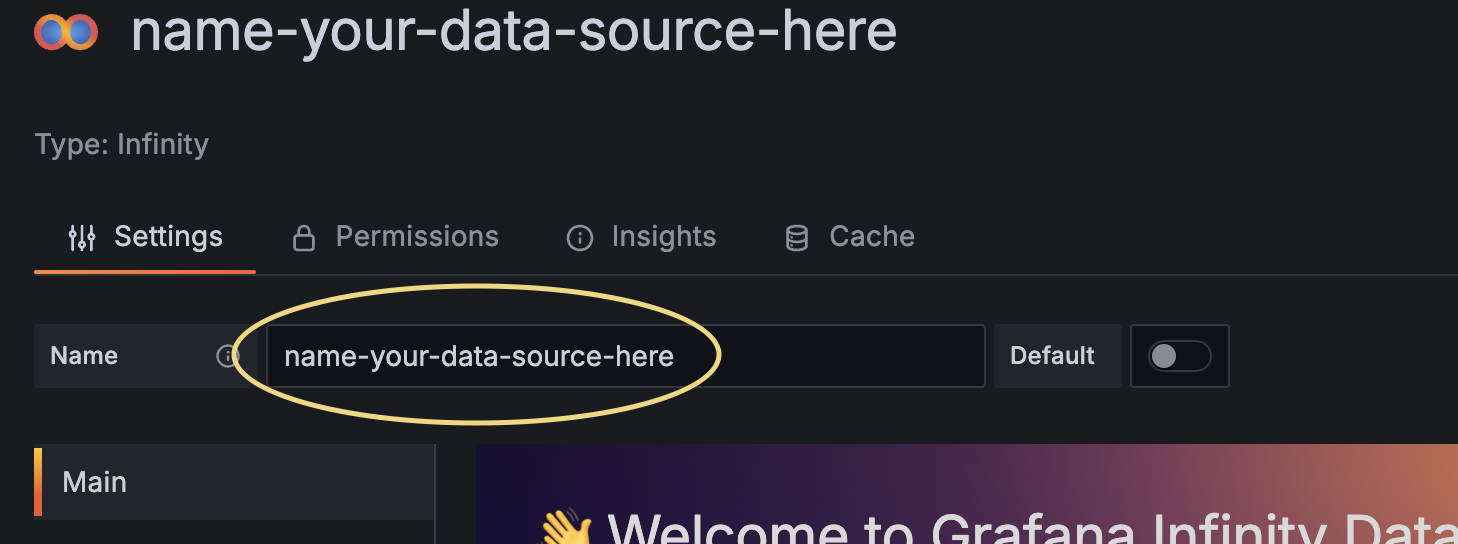
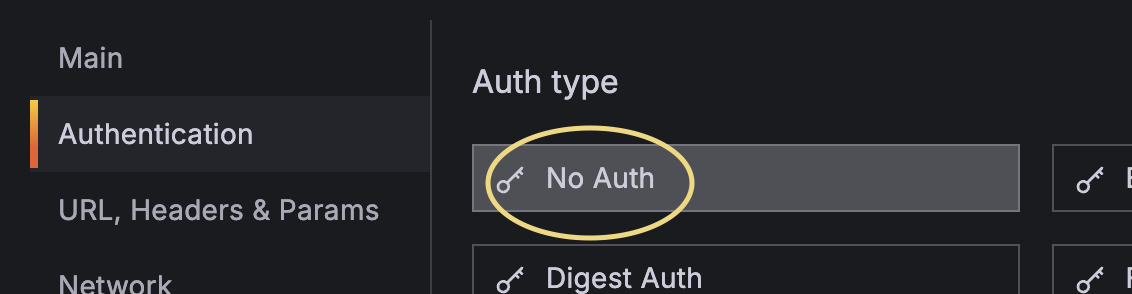
- Open Setup authentication and choose No auth
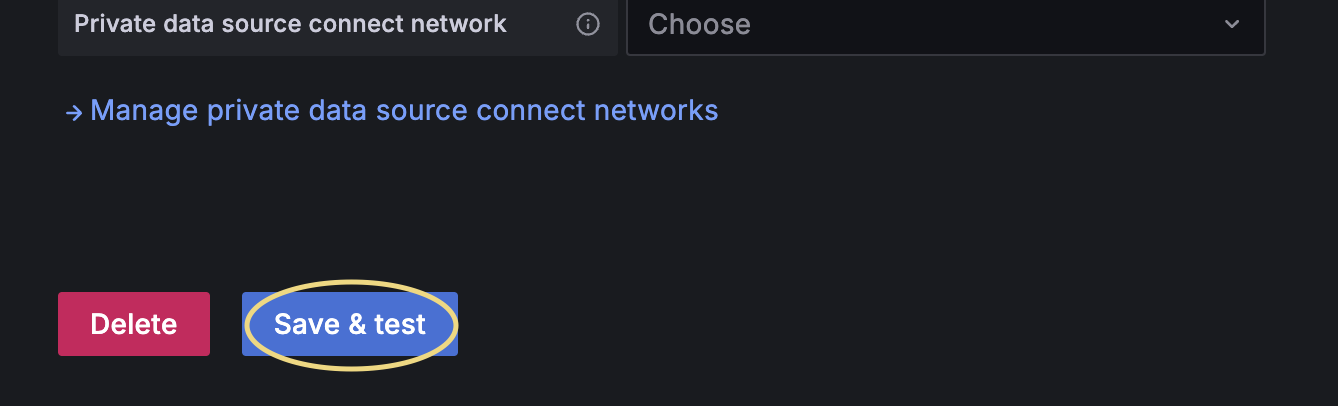
- Click Save & test
5. Create your first panel
- Go to Dashboards
- Click New in the top right
- Choose New dashboard
- Click + Add visualization
- On Select data source choose the Infinity data source
6. Connect your panel to your Orca sheet
- In the query editor, set Type to CSV
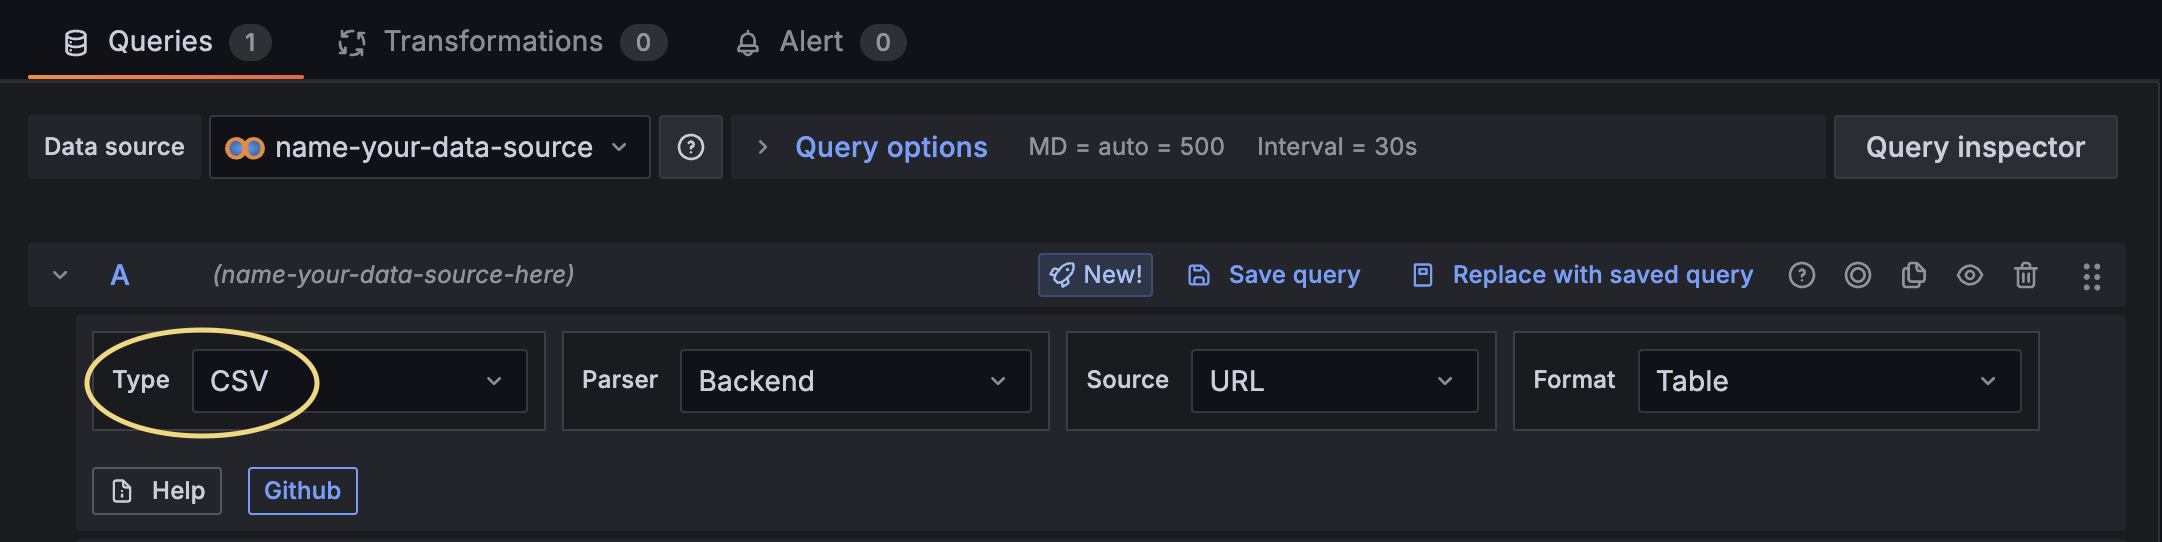
- Set Parser to Backend
- Set Source to URL
- Set Format to Table
- Set Method to GET
- Enter your Live Data URL (add
.csvto the end) - Click Refresh
7. Make numbers and dates usable
If a column like Quantity appears as text, convert it so you can sum or graph it.
- Open the panel and go to Transform
- Click Add transformation
- Choose Convert field type
- Set the field type to Quantity
- Set the type to Number
- Set type to Time for date or time columns
- Finally, click Save dashboard
Done! You now have a Grafana dashboard allowing you to see everything you’re tracking.
Have a question about using Orca Scan with Grafana?
We’re always happy to help, chat with us live or drop us an email.
Request an integration
Need help getting Orca Scan working with your software? Request a Software Integration