1. Sign up for Data Studio
Data Studio runs in the browser, so you can use it on both Windows and Mac without any installation. Just head to datastudio.google.com to get started.

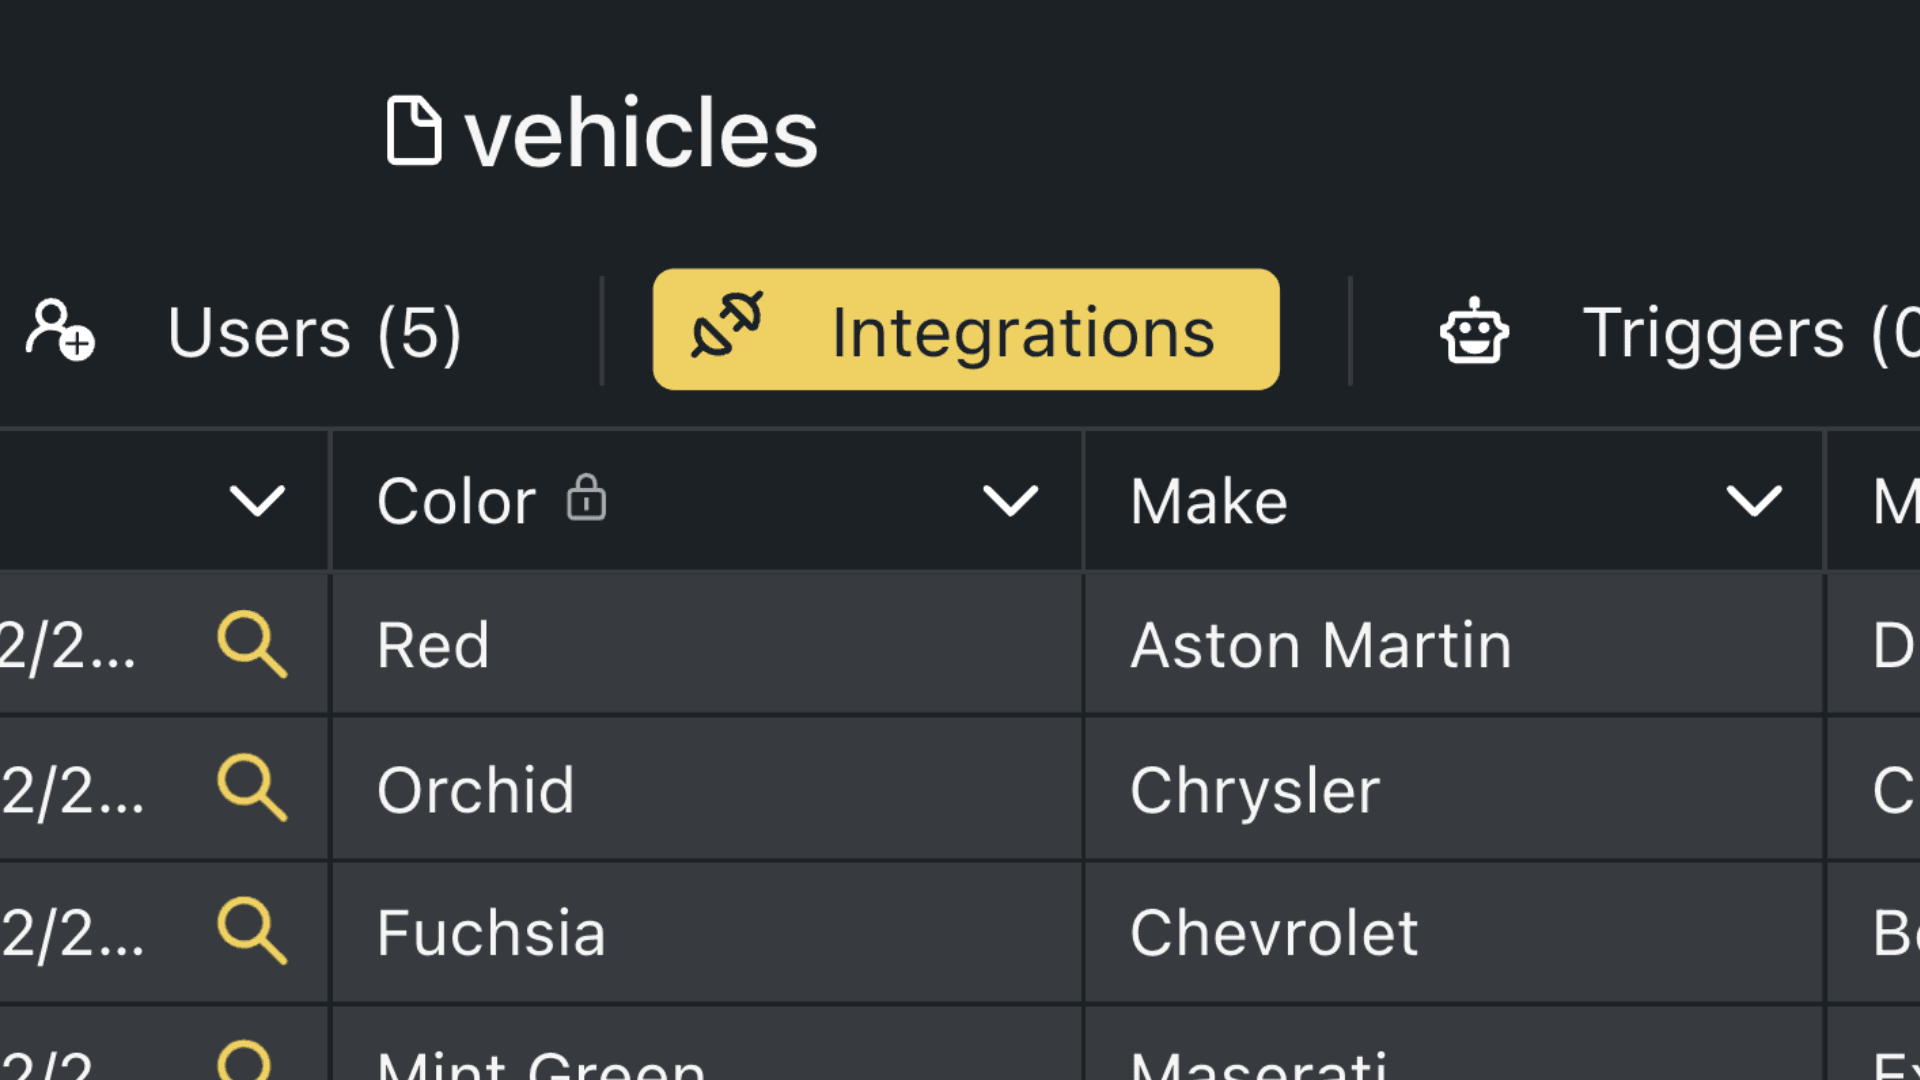
2. Go to Integrations in Orca
Login to your Orca Scan account, select the sheet that you want to connect to Data Studio and head to the Integrations settings.
3. Get Live Data URL
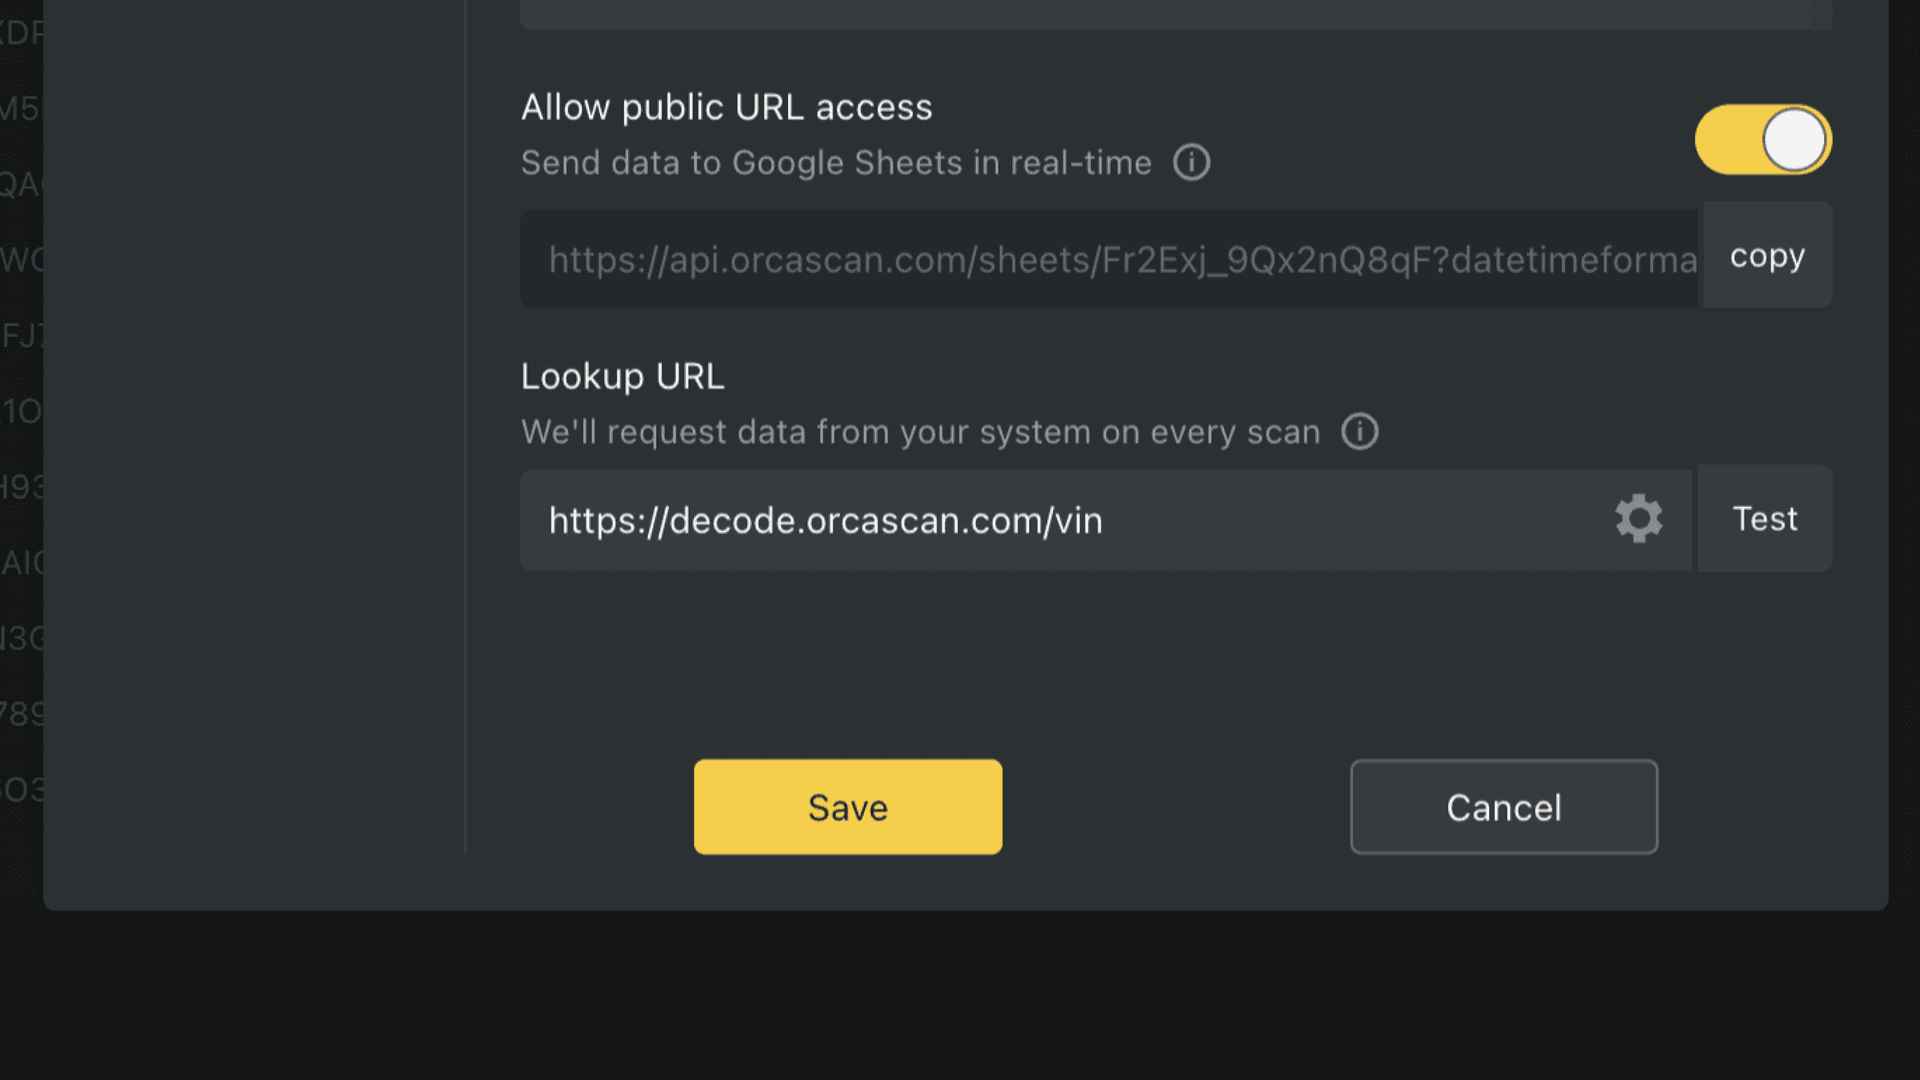
Enable “Allow public URL access” and copy the Live Data URL to your clipboard. You’re going to add this URL to a Google Sheet, which will be used as the data source for Data Studio to query your Orca Scan data.
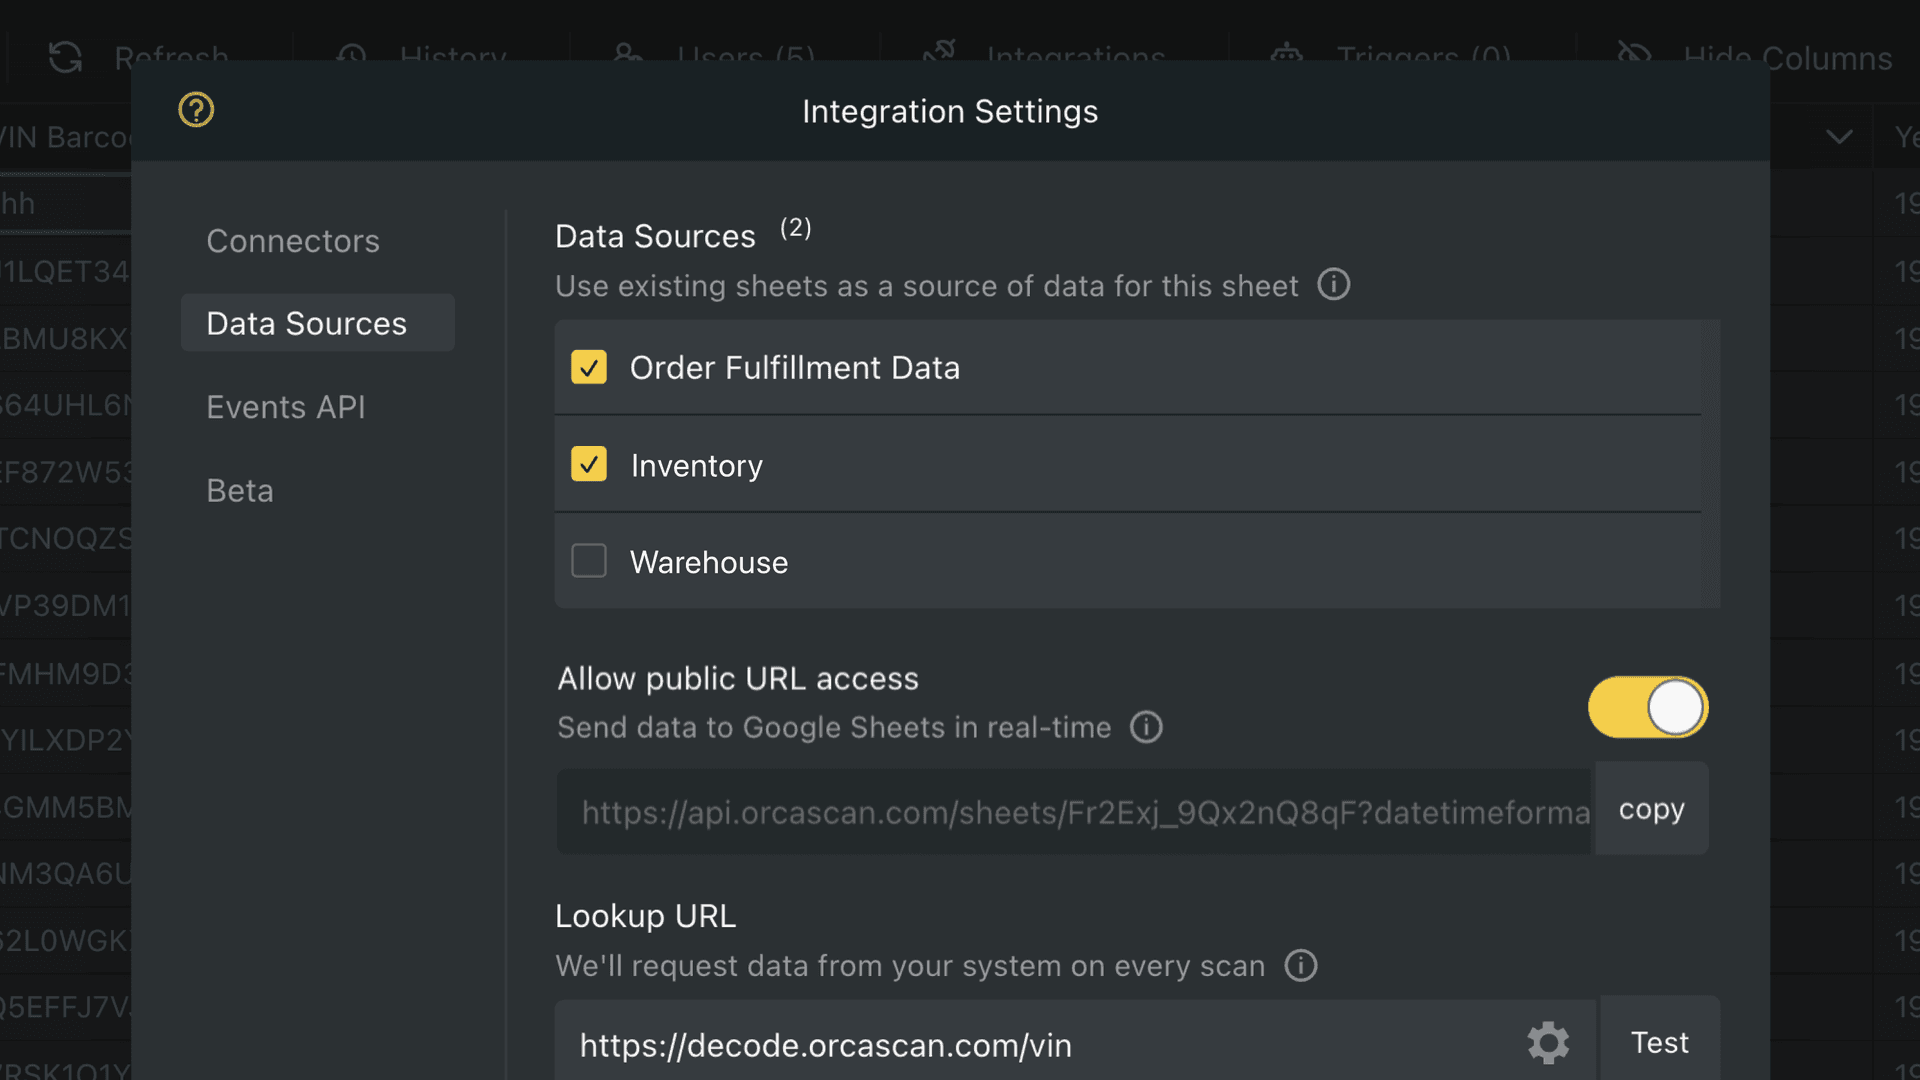
As an additional confirmation check, you must save the integration changes.
Now, let’s head over to Google Sheets…
4. Create a Google Sheet
When connecting directly to Data Studio, you can only refresh the data every 12 hours. So, we’re going to set up a Google Sheet as the data source we can refresh every 15 minutes.
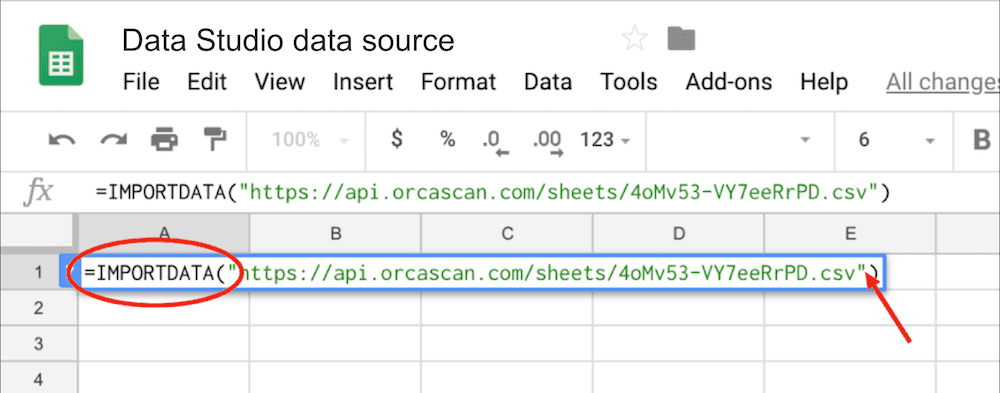
5. Add IMPORTDATA formula
Once you’ve got an empty Google Sheet, place the cursor in the A1 cell and add the =IMPORTDATA formula.
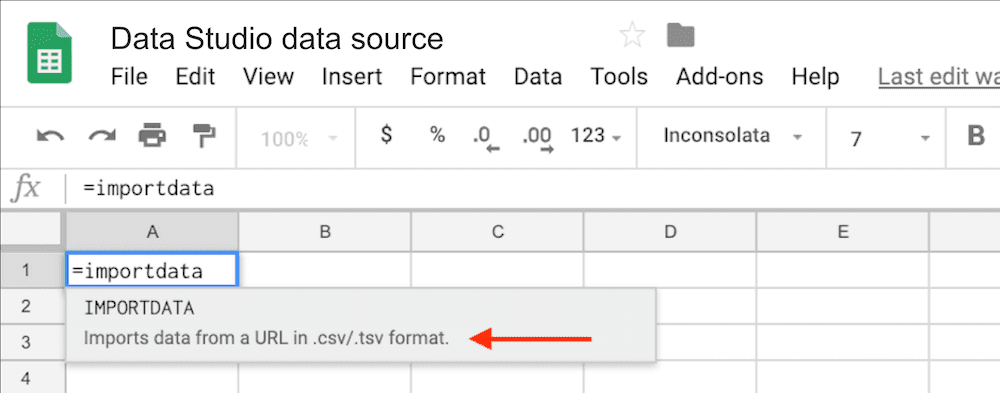
Paste the export link
Now add the Live Data URL from Orca Scan within the brackets =IMPORTDATA("replace-with-your-orca-sheet-url-here.csv").
Important: be sure to include the quotation marks!
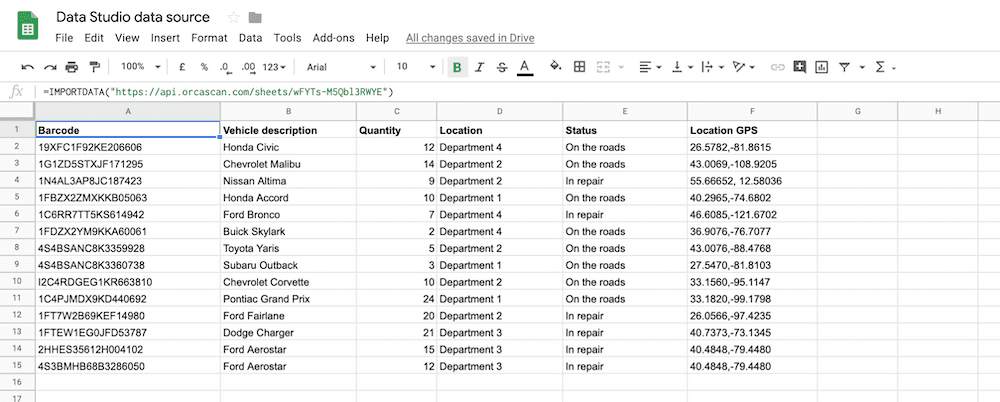
Once your data is loaded into the sheet you can now use it as the data source to build your reports in Data Studio.
Next, over to Data Studio…
6. Add the sheet as the data source in Data Studio
Reports are built around data sources, so you won’t see any editor controls or menus until you add one. You can add your Google Sheet in these 4 steps:
- On the left, click Create Data Source
- Scroll down and find the Google Sheets connector
- Select your sheet and click Connect
- Change the field data types if needed
Learn more
Here’s the full guide to creating data sources.
7. Create a report
You can now build reports. Start by adding a new blank report.
Then select your new Data Source in the Data Source Picker on the right, and add your first chart from the Add a chart option in the toolbar.
Learn more
In the example above, we have used a GPS location map and a simple Pie chart. For a more in-depth guide on creating reports, read this Tutorial: Create a new report.
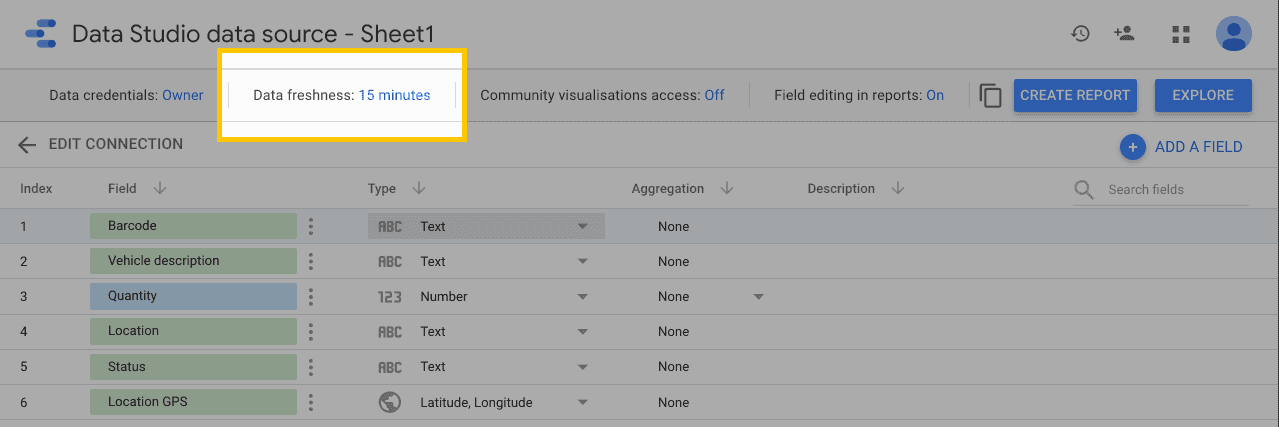
How to refresh data
You can refresh the cache at any time by viewing or editing the report and clicking Refresh data, but you can also control how often to run the refresh.
By using Google Sheets as the data source, you can set that to every 15 minutes.
It happens at the Data Source level, so you need to Edit the data source, and in the toolbar at the top, set the Data freshness.
Have a question about using Orca Scan with Data Studio?
We’re always happy to help, chat with us live or drop us an email.
Request an integration
Need help getting Orca Scan working with your software? Request a Software Integration