In this guide, we’ll walk you through using Microsoft’s free business analytics application Power BI Desktop to visualise Orca Scan data in real-time.
1. Install Power BI
To get started download and install Microsoft Power BI on your Windows machine.
Mac
There are options to install Power BI on a Mac, but we must admit it’s not straightforward. Consider using Google Data Studio instead
2. Open Sheet Integrations
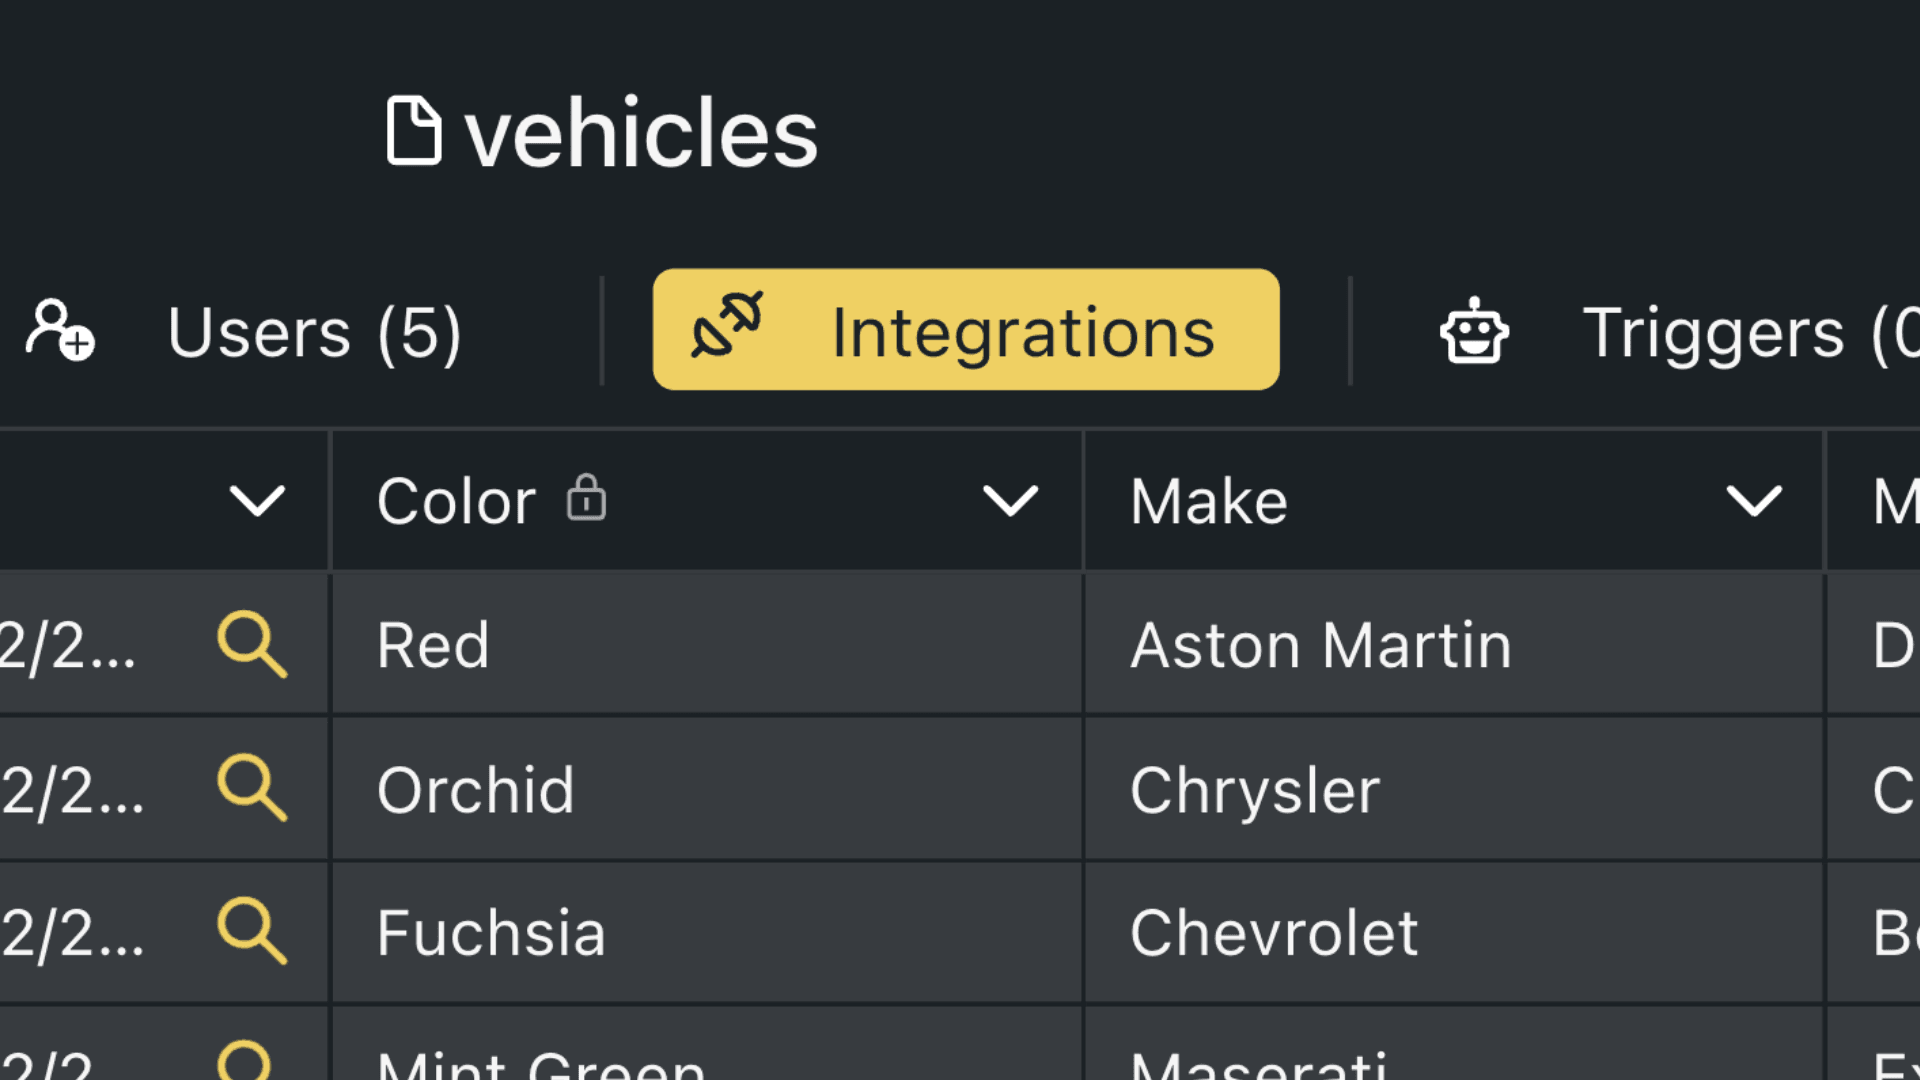
Login to your Orca Scan account, select the sheet that you want to connect to Power BI and open the Integrations settings.
3. Get Live Data URL
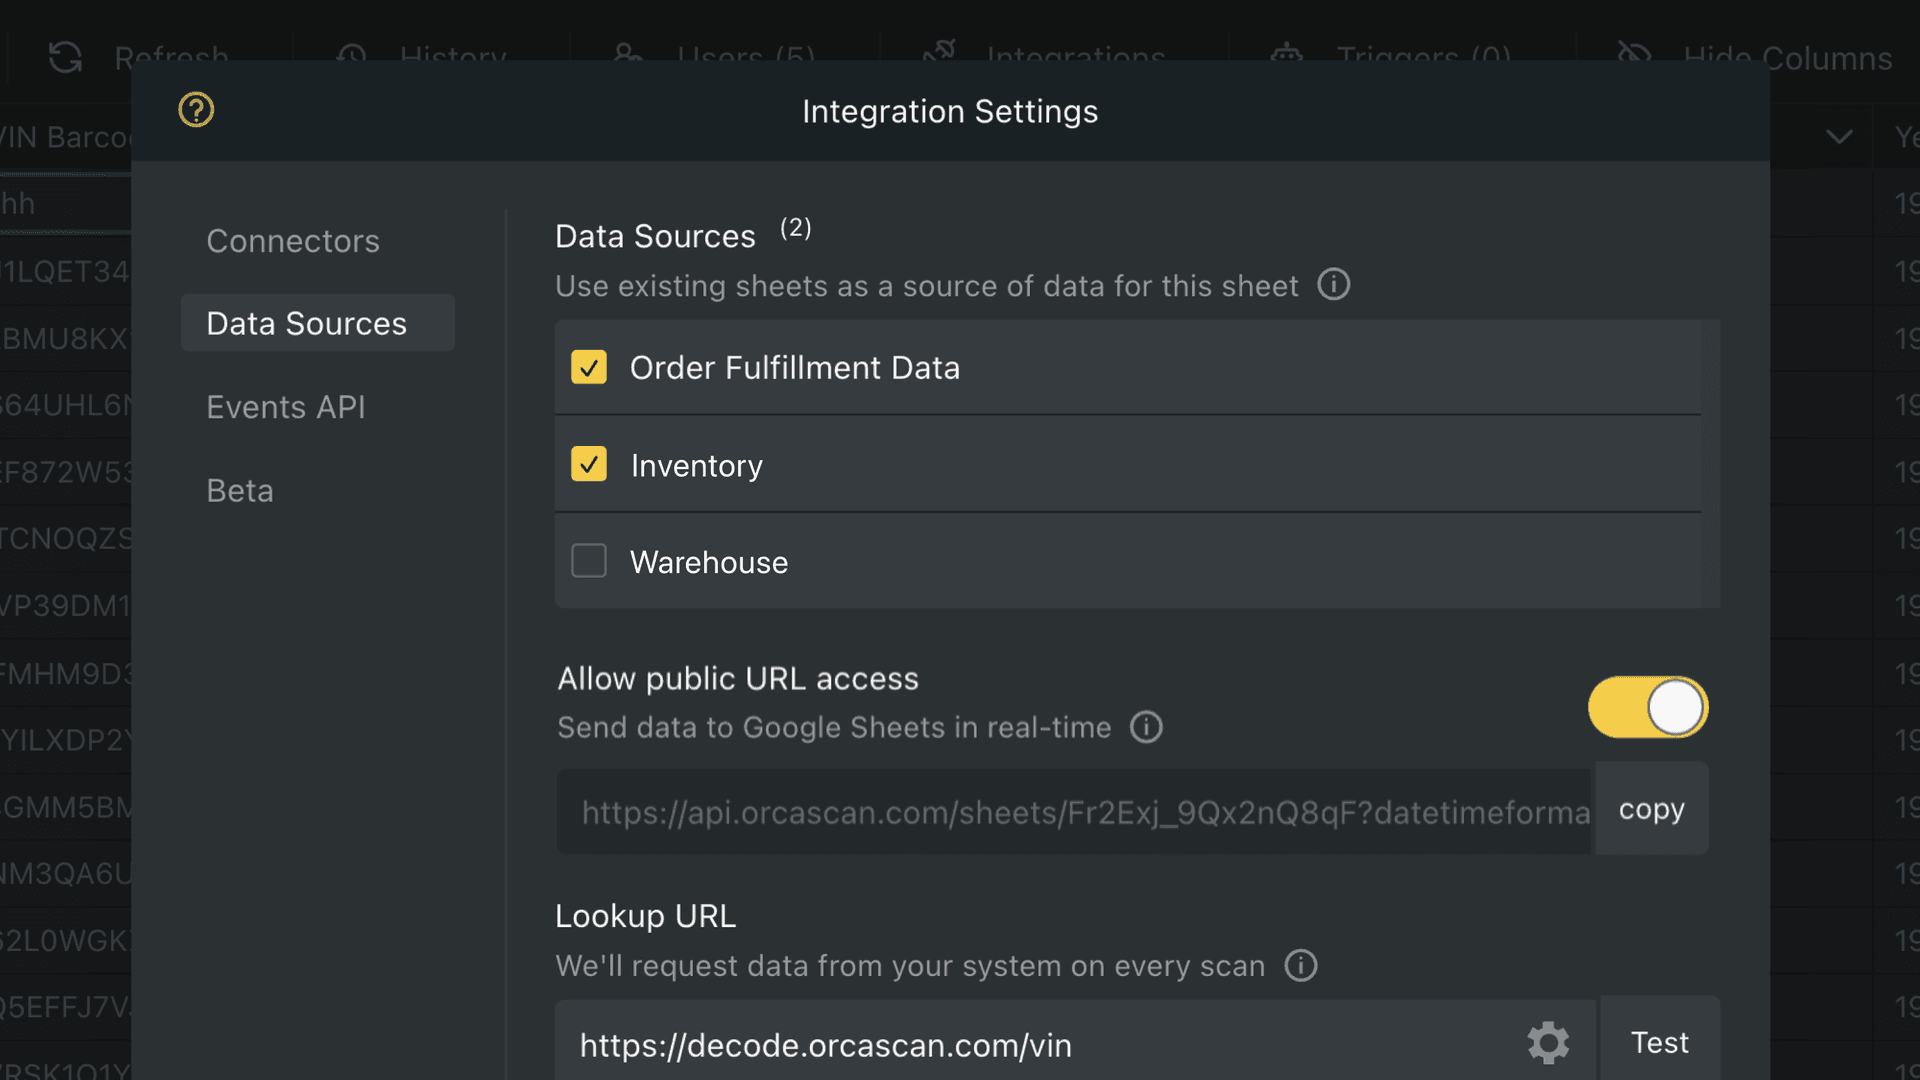
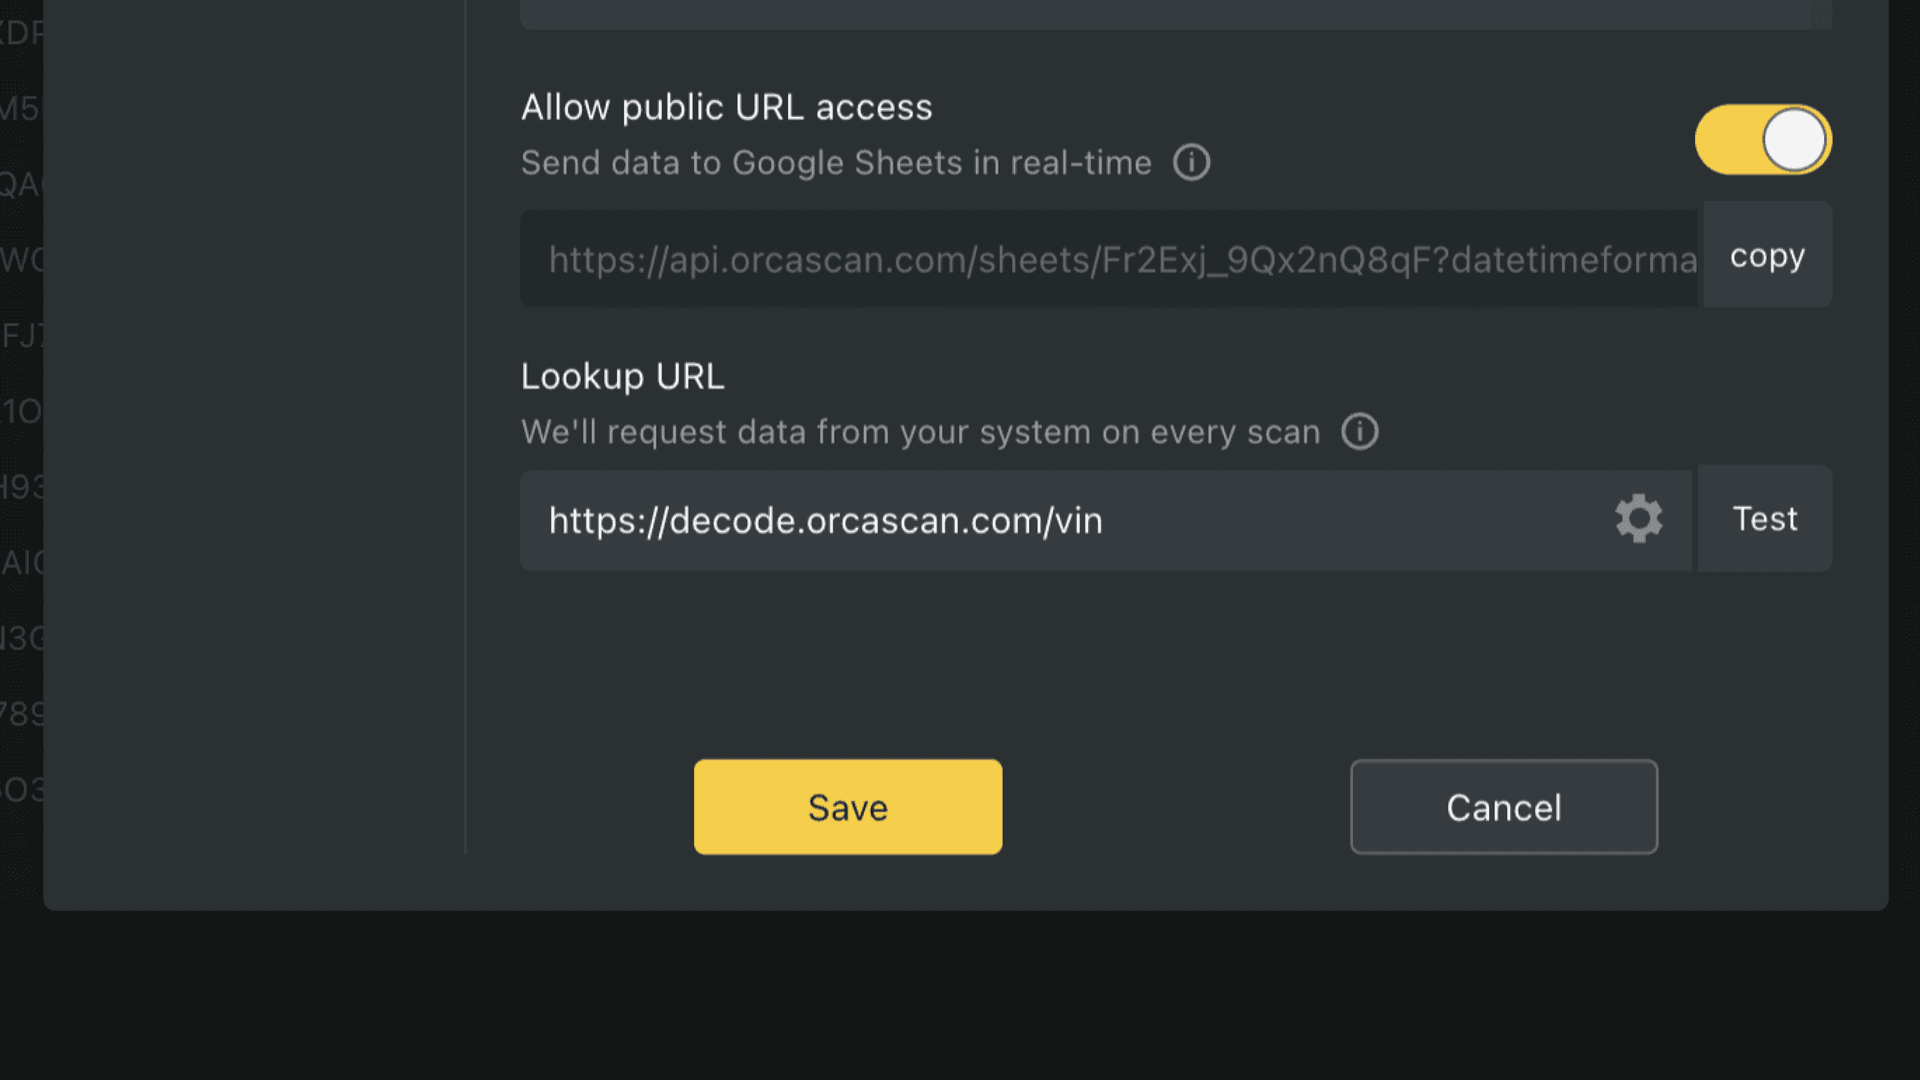
Enable “Allow public URL access” and copy the Live Data URL to your clipboard. Power BI will use this URL to query Orca Scan data in real-time.
As an additional confirmation check, you must save the integration changes.
Now, let’s head over to Power BI…
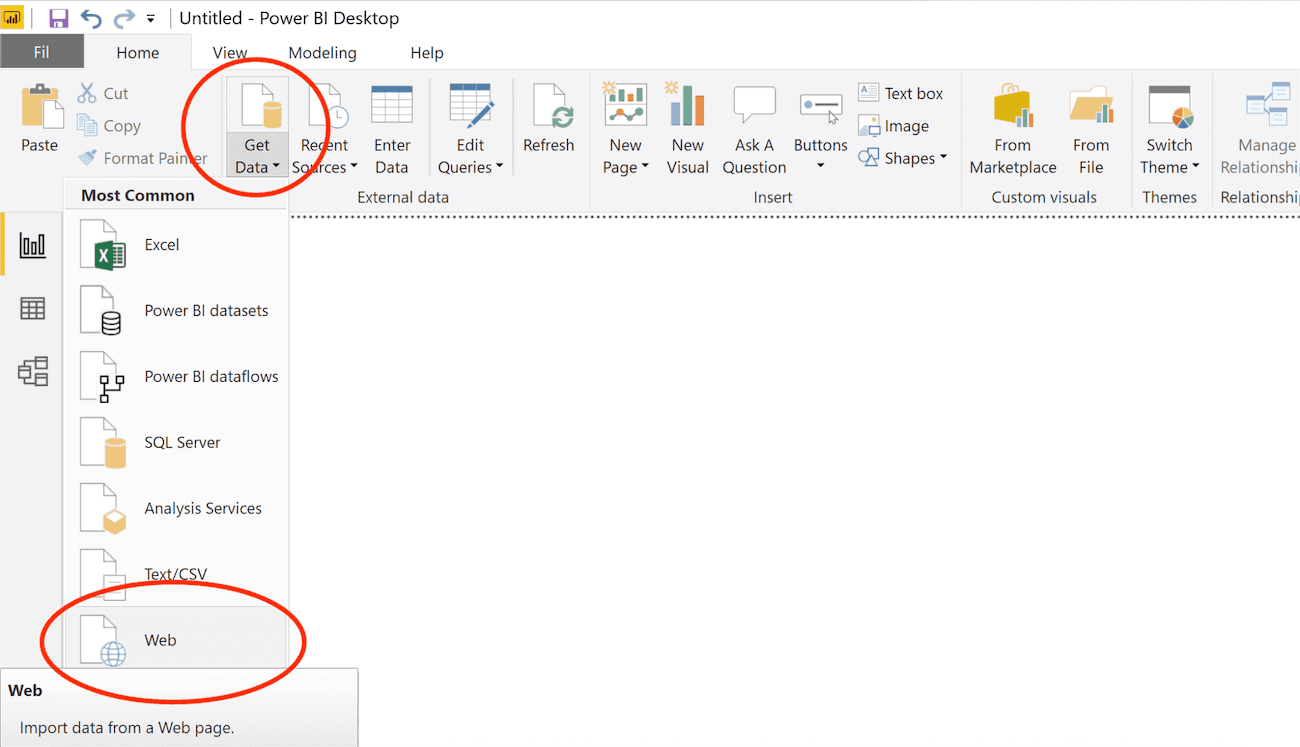
4. Get Data in Power BI
Find the Get Data menu, and select the option Web.
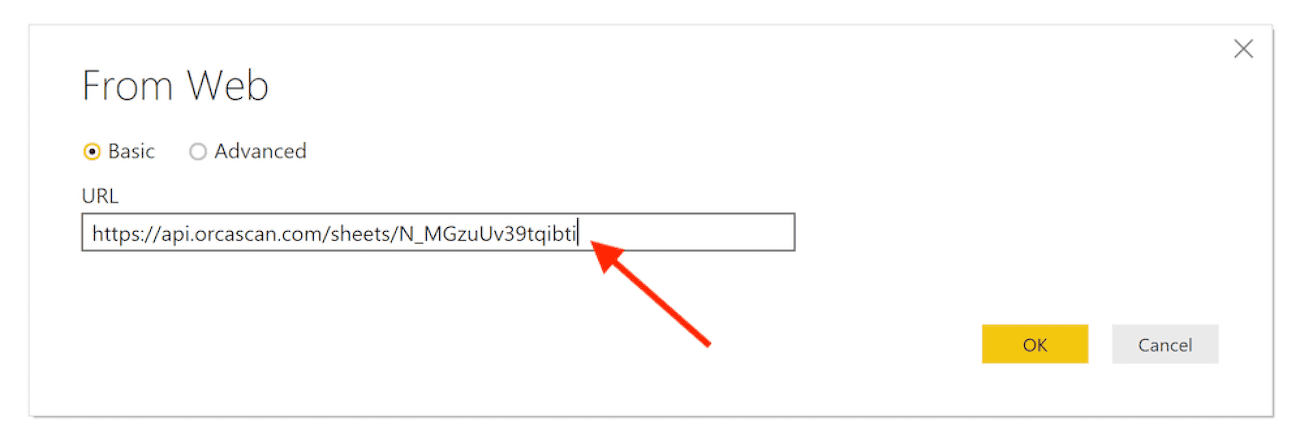
5. Paste the Live Data URL
You will get the option to paste a URL. Insert the Live Data URL from your Orca Scan sheet here.
Advanced: configure the data export
You can append the parameters below to the URL to configure the data output. For instance, to include the historical records or change the date/time format.
View the Live Data URL documentation for a detailed overview of the parameters.
| Function | URL parameter |
|---|---|
| Sort output by column | sortby=barcode&sortorder=desc |
| Change output format | .html / .csv / .json / .xml |
| Include audit trail | transactions=true |
| Include deltas for numeric columns | deltas=true |
| Change date format | datetimeformat=DD/MM/YYYY |
| Change time zone | timezone=-03:00 |
Important: always use a ? before the first parameter and an & before each additional parameter, for example:
https://api.orcascan.com/sheets/sJ0KYsnp-9b7Rl7i?transactions=true&deltas=true
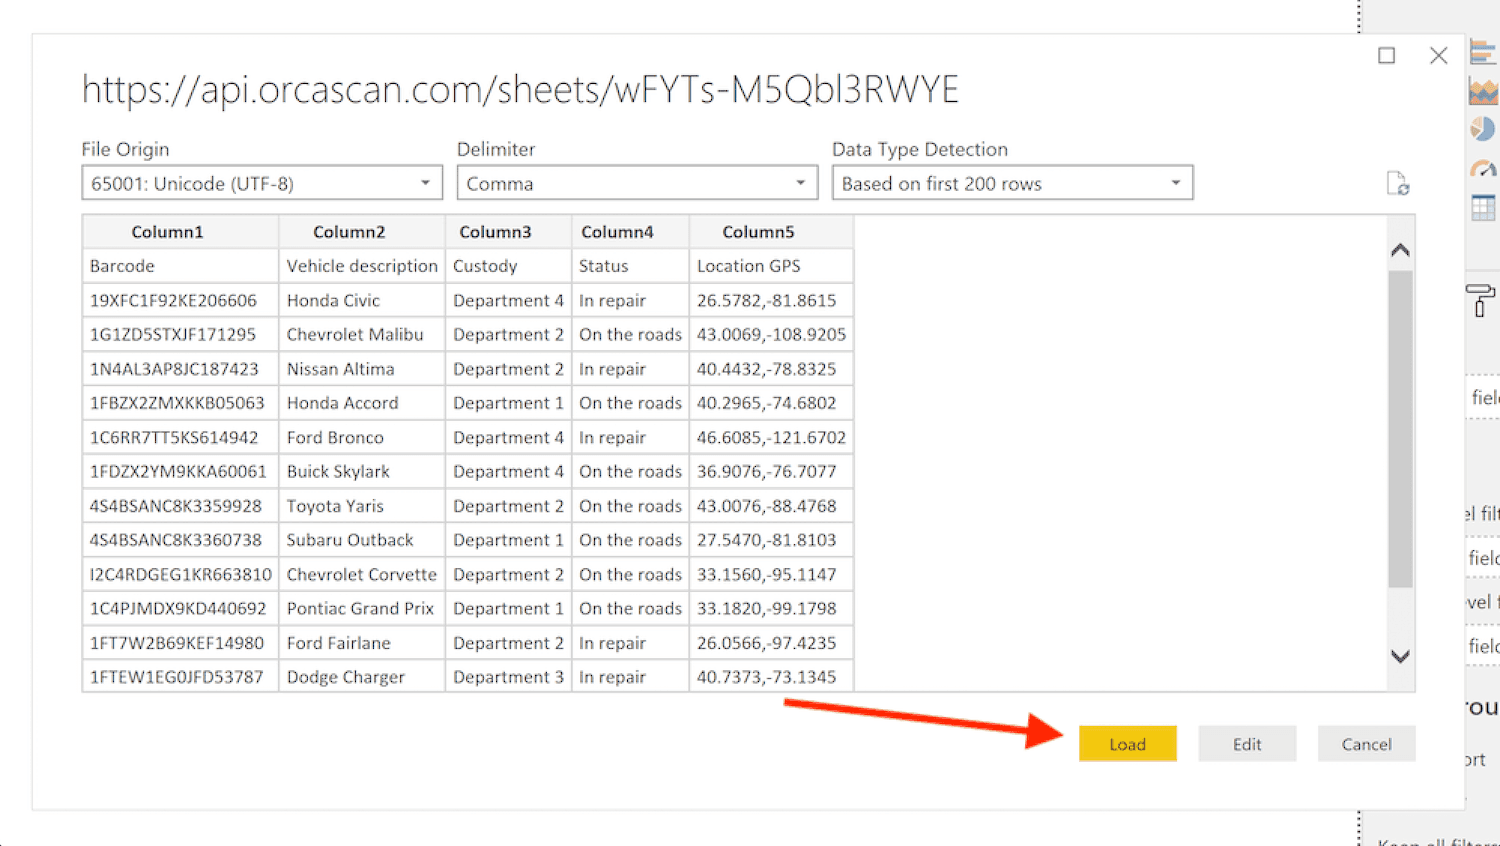
6. Review and confirm
If everything looks good, click load.
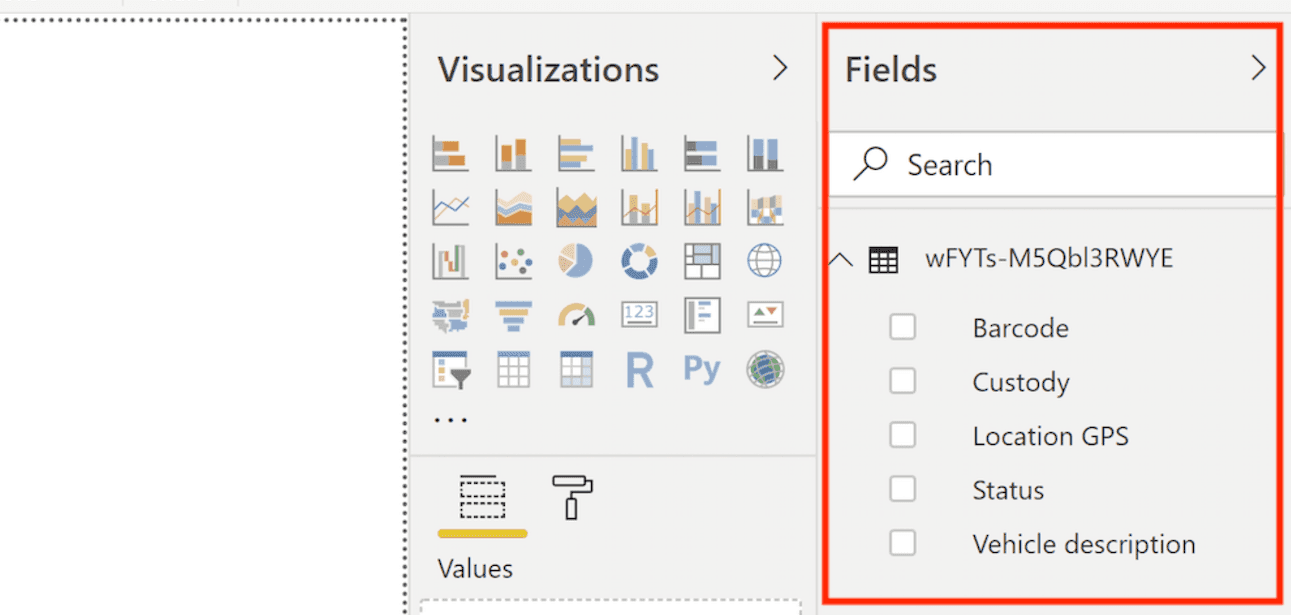
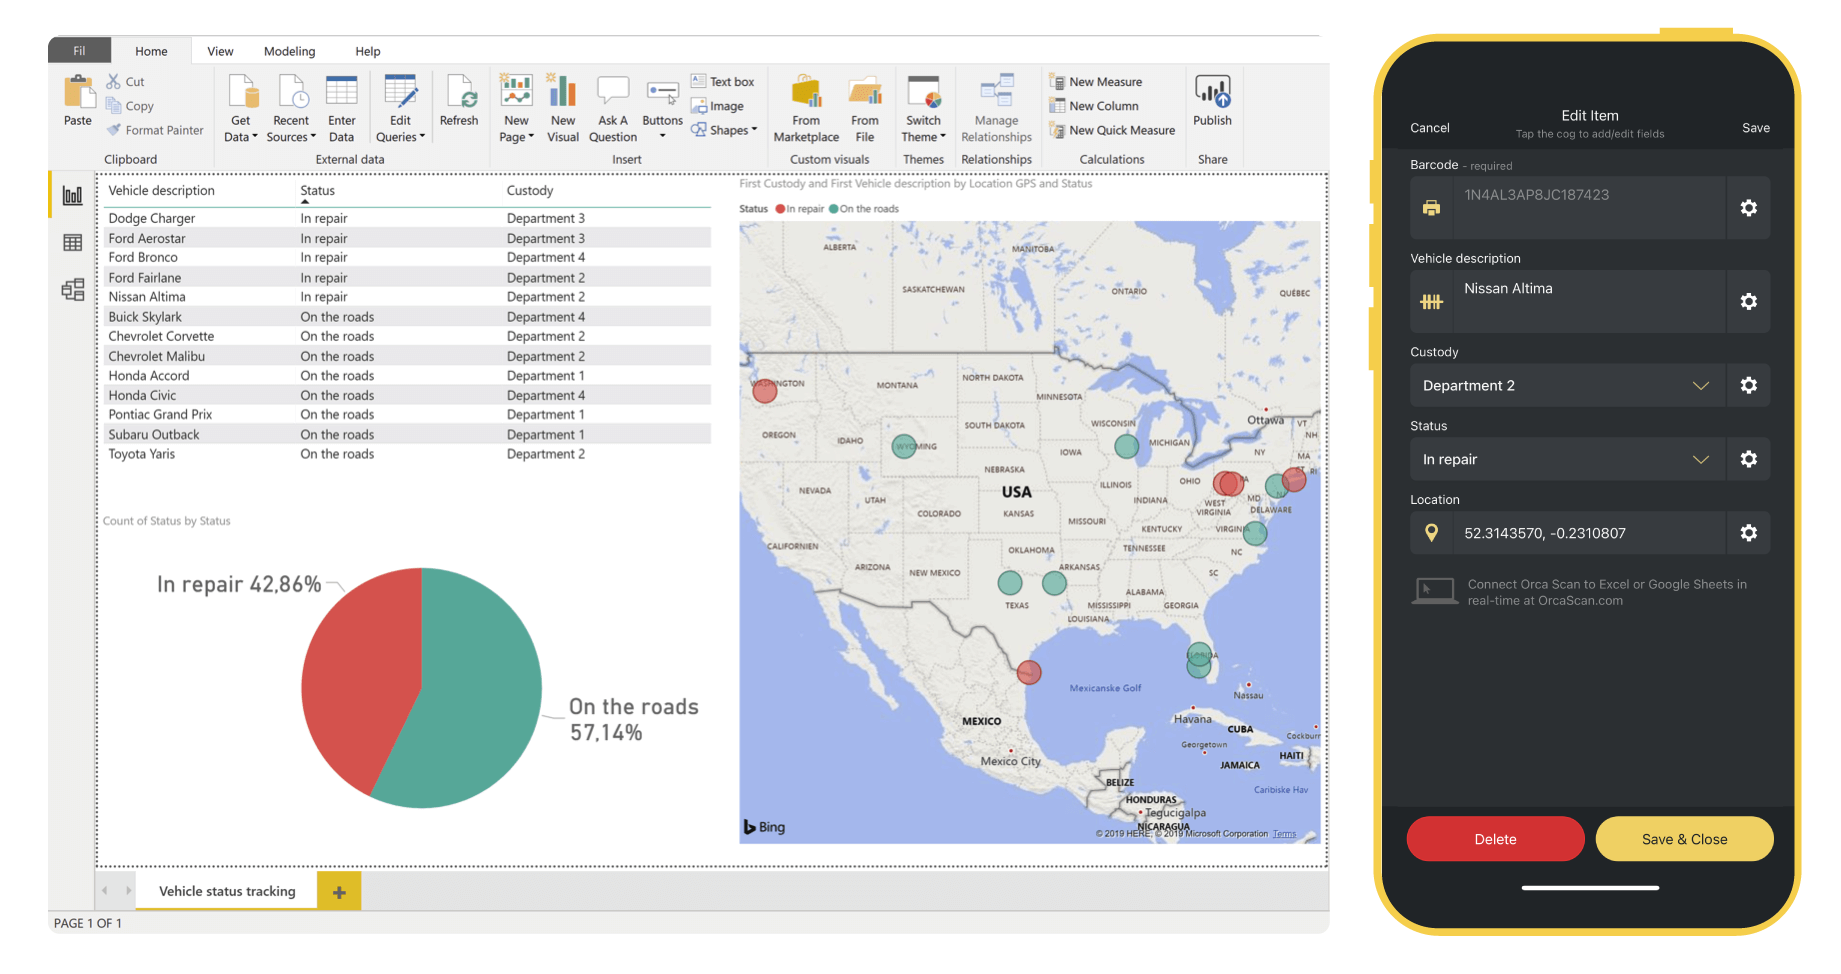
You will now be able to view your data in the Fields pane. Right next to it, we have the Visualisation options to create charts.
How to create a chart
Start out by selecting one of the Visualisation options, then drag your fields into it
GPS location map
In this example, we’re using a Map to visualise the location of our vehicles, a Pie chart to view the vehicle status, and a Table for a general overview
How to refresh data
You can refresh the data to pull in the changes from Orca Scan as often as you like.
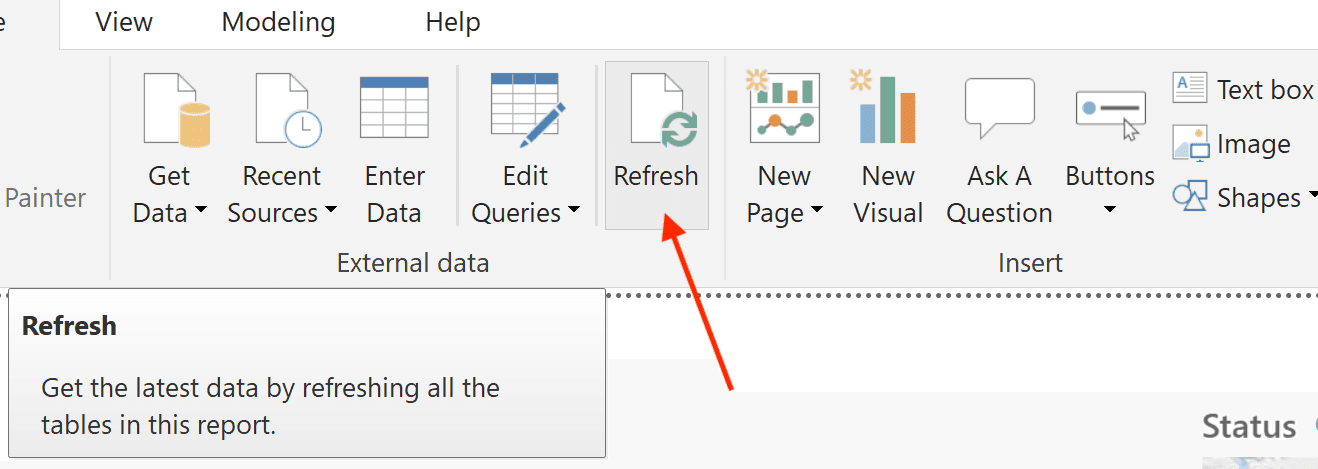
You can also set the frequency or schedule specific time slots to refresh your reports. In some cases, scheduling requires a gateway in Power BI. You can read more about scheduling in Power BI’s refresh configuration guide.
Have a question about using Orca Scan with Power BI?
We’re always happy to help, chat with us live or drop us an email.
Request an integration
Need help getting Orca Scan working with your software? Request a Software Integration